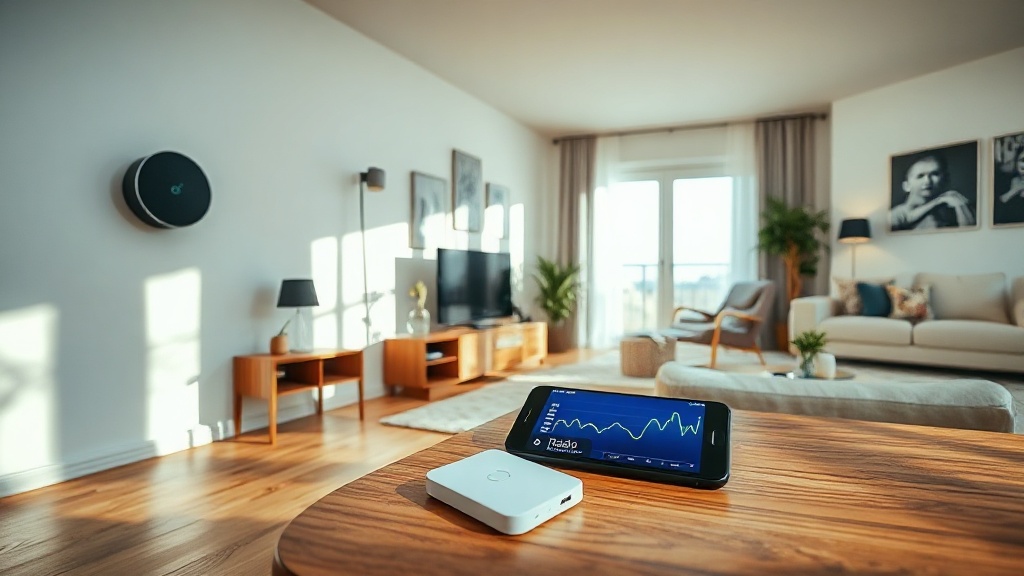
Introduction to Airthings Wave Plus Long-Term Radon Trend Analysis
Radon gas is a leading cause of lung cancer in non-smokers, making accurate long-term monitoring essential for home safety. The Airthings Wave Plus, a popular Bluetooth-enabled radon detector, offers continuous measurement with a unique wave-to-view interface. Understanding how to interpret its seasonal data trends is key to making informed mitigation decisions.
This article explores the intricacies of the Airthings Wave Plus long-term radon trend analysis, focusing on seasonal variations and data interpretation for UK homeowners and professionals.
How Does the Airthings Wave Plus Track Radon Over Months and Seasons?
The Airthings Wave Plus uses a passive diffusion chamber with an alpha spectrometer to measure radon levels. Unlike short-term test kits that provide a snapshot, this device continuously samples air every 10 minutes, storing hourly averages for up to 12 months of data. This allows it to capture seasonal fluctuations driven by weather, ventilation habits, and building pressure changes.
For example, in winter, homes often have closed windows and lower ventilation, increasing radon concentration. The Wave Plus records this as a seasonal high, while summer levels may drop due to open windows and increased airflow. The device’s onboard memory stores rolling averages (1-day, 7-day, and long-term) which are accessible via the Airthings app or dashboard. To interpret trends accurately, focus on the long-term average (over 3 months or more), as it smooths out daily spikes and reflects true exposure risk.
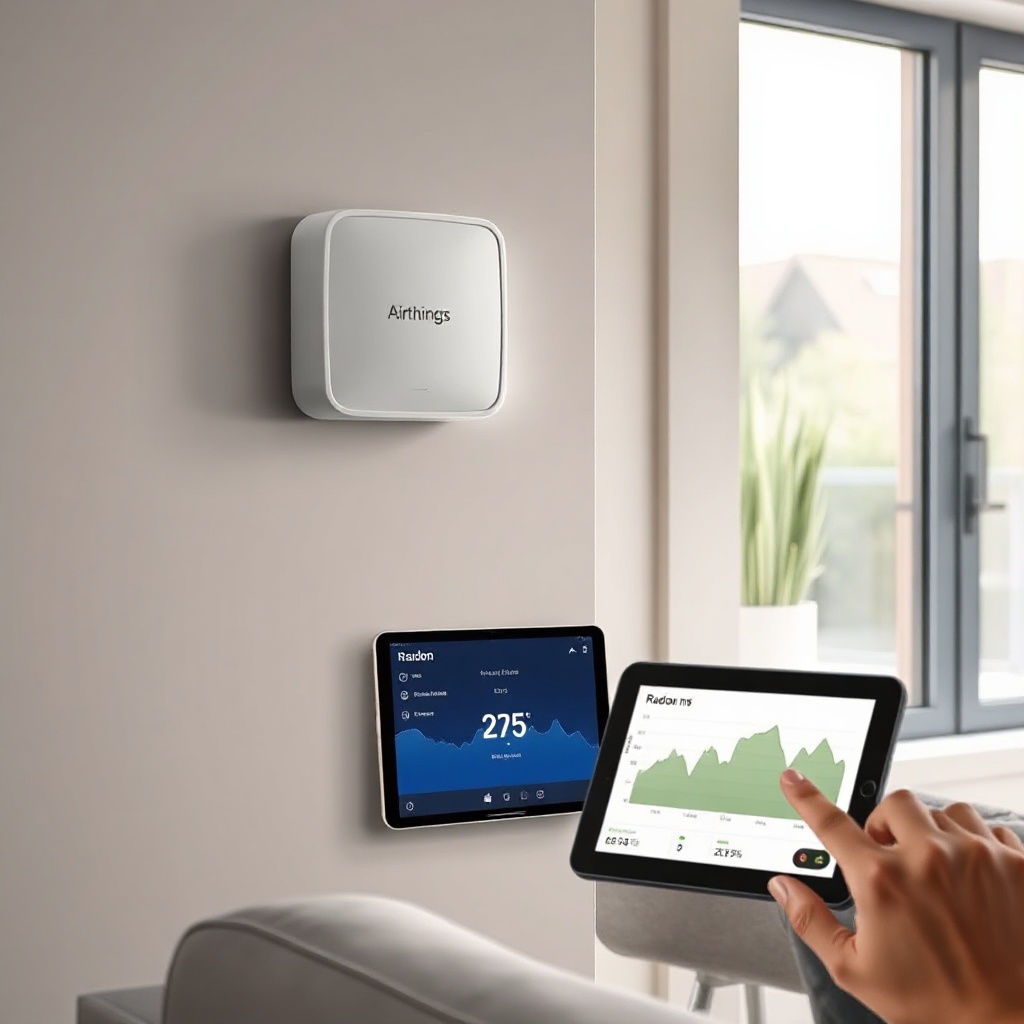
What Do Seasonal Data Patterns Reveal About Radon Risk?
Seasonal radon data reveals critical insights into your home’s behavior. The Airthings Wave Plus detects these patterns through its continuous logging. Key seasonal trends include:
- Winter Peaks: Higher indoor pressure and sealed windows trap radon, often doubling summer levels. In the UK, average radon in winter can exceed 200 Bq/m³ in affected areas.
- Summer Dips: Increased ventilation and open windows lower concentrations, sometimes below 50 Bq/m³.
- Spring/Fall Transitions: Transitional months show variability as weather changes impact soil gas entry.
A consistent seasonal pattern, such as a 100 Bq/m³ difference between summer and winter, indicates a soil gas entry issue. Mitigation must address year-round exposure, not just peak months. For a deeper comparison, see our Airthings Wave Plus vs Sun Nuclear Radon Eye RD200: Accuracy and Features Comparison.
To quantify severity, refer to the table below which shows typical radon levels and recommended actions based on UK standards (WHO reference level: 100 Bq/m³).
| Average Long-Term Radon (Bq/m³) | Seasonal Pattern | Risk Level | Recommended Action |
|---|---|---|---|
| < 50 | Stable across seasons | Low | Continue monitoring; no immediate action |
| 50 – 100 | Winter peaks to 150 Bq/m³ | Moderate | Improve ventilation; retest in 12 months |
| 100 – 300 | Winter > 300 Bq/m³, summer < 100 Bq/m³ | High | Radon mitigation recommended (sub-slab depressurisation) |
| > 300 | Winter > 500 Bq/m³ year-round | Very High | Professional mitigation required immediately |
How Do You Access and Read Long-Term Trends on the Airthings App?
The Airthings companion app (available for iOS and Android) provides graphical trend data. To access long-term trends:
- Open the app and select your Wave Plus device.
- Tap the “History” tab to view daily, weekly, or monthly graphs.
- Choose “12 months” to see seasonal variations. Use the “Average” toggle to show rolling averages (e.g., 7-day or 30-day).
- Interpret the graph: Look for consistent peaks in winter and troughs in summer. A red line at 100 Bq/m³ indicates the WHO reference level.
The device also calculates a “long-term average” (LT) displayed on the main screen. For instance, if your LT shows 95 Bq/m³ but winter spikes touch 180 Bq/m³, mitigation is advisable. Ensure you sync the device via Bluetooth weekly to maintain data continuity. For battery management tips, read our guide on Airthings Wave Plus Battery Life Optimization Tips.
What Are the Limitations of Wave Plus Seasonal Data?
While powerful, the Airthings Wave Plus has limitations in seasonal trend interpretation:
- Bluetooth Range: Data is only stored on the device until synced to your phone. If you miss syncing for weeks, gaps appear in the log.
- No Internet Connectivity: Without a hub, you must manually sync via Bluetooth. This can miss short-term spikes.
- Sensor Drift: Over years, calibration may drift, though Airthings claims ±13% accuracy at 100 Bq/m³.
- Placement Sensitivity: Radon levels vary by room; a single device in the basement may not reflect upstairs exposure.
To mitigate these, place the Wave Plus in the lowest living area (e.g., living room), sync weekly, and cross-reference with a professional test every 2 years. For extended monitoring, see our Airthings Wave Plus Battery Life Tips: Extend Monitoring with RadonClear to ensure uninterrupted data collection.
What Do Owners Say About Long-Term Radon Trends?
Many UK users on forums like RadonClear and Amazon report satisfaction with the Wave Plus for trend analysis. A homeowner in Cornwall noted, “After 18 months, the Wave Plus clearly showed winter peaks of 220 Bq/m³ versus summer lows of 60 Bq/m³. This convinced me to install a mitigation system, which now keeps levels below 50 Bq/m³ year-round.” Another user in Scotland valued the 12-month graph: “The app’s trend view made it easy to explain risks to my family and justify the £1,500 mitigation cost.”
Critics mention Bluetooth sync frustration: “I forgot to sync for a month, losing a week of data. Ensure you create a weekly habit.” Overall, owners appreciate the simplicity and visual trend data, with long-term averages being the most trusted metric. The device’s price of around £199 (including VAT) is considered reasonable for continuous monitoring.
How Can You Use Seasonal Data to Justify Radon Mitigation?
Seasonal data from the Airthings Wave Plus provides concrete evidence for radon remediation. If your long-term average exceeds 100 Bq/m³, or winter peaks consistently breach 200 Bq/m³, present the 12-month graph to a mitigation professional. Many UK contractors accept Wave Plus data as preliminary evidence, though a charcoal test may be required for formal reports. For example, a homeowner in Devon used their Wave Plus graphs to convince a local council to fund mitigation via a loan scheme, citing the clear winter-summer disparity.
The UK Radon Risk Map (UKHSA) identifies high radon areas; seasonal trends can help prioritise action. Once mitigation is installed, continue monitoring—the Wave Plus will show reduced levels within days, confirming system effectiveness. For best practices, pair the device with a heat recovery ventilator (HRV) to stabilise seasonal fluctuations.
Frequently Asked Questions
1. How long does the Airthings Wave Plus store radon data?
It stores hourly averages for up to 12 months on the device. After syncing via Bluetooth, data is saved indefinitely in the app. For longer trends, export the CSV file from the app every few months.
2. Can the Wave Plus detect radon spikes accurately?
Yes, it samples every 10 minutes and detects short-term spikes (e.g., after a storm). However, its accuracy is ±13% at 100 Bq/m³, so spikes below 30 Bq/m³ may be within noise margin.
3. What is the ideal placement for seasonal radon monitoring?
Place the Wave Plus in the lowest frequently occupied room (e.g., living room or home office) at least 1.5 m above the floor and away from draughts. Avoid kitchens and bathrooms due to humidity interference.
4. How often should I sync the device to avoid data loss?
Sync at least once a week via Bluetooth. The device memory holds about 12 months of hourly data, but gaps occur if you miss multiple syncs and the battery dies (9-year battery life).
5. Does the Wave Plus work in basements with high humidity?
Yes, it is rated for 0-85% non-condensing humidity. In very damp basements (>85%), use a dehumidifier to prevent condensation on the sensor, which may affect readings.
6. What is the cost of the Airthings Wave Plus in the UK?
The retail price is approximately £199 including 20% VAT. Some retailers offer bundles with a hub for £249. It is available from Amazon UK, RS Components, and direct from Airthings.